

Regional Working Group on American Monsoons
About American Monsoons
The Working Group on American Monsoons (WG-AMM) works with the CLIVAR/GEWEX Monsoons Panel in dealing with the regional aspects of the American Monsoon (AMM) system, comprising the South American, Central American and North American monsoons.
-
The North American Monsoon System
The South American Monsoon System (SAMS) features well-defined wet (October-March) and dry seasons (June-August) despite the lack of a seasonal reversal in wind direction (Figure 1). The onset of the wet season typically occurs in October, marked by an intensification of convective activity and a large-scale reorganization of atmospheric circulation, including the establishment of an upper-level anticyclone known as the Bolivian High (Figure 2a,d). The peak of the wet season extends from December to February (DJF), when precipitation intensifies over central-western Brazil, southern Amazonia, and the La Plata Basin. More than 50% of the total annual rainfall occurs in some regions during this period (Figure 2), particularly over southern Amazonia and the Brazilian Plateau, highlighting the strong monsoonal contrasts.
Moisture for SAMS is primarily transported from the tropical Atlantic via the trade winds and is funnelled across the continent by the South American Low-Level Jet (SALLJ). Additionally, the South Atlantic Subtropical Anticyclone (SASA) contributes by transporting warm, moist air from the ocean toward southeastern Brazil. Like other monsoon systems, SAMS exhibits active and break phases. When the SALLJ is strong, moisture is transported away from the tropics, weakening SAMS and enhancing precipitation over subtropical South America.
Another feature characterizing SAMS is the presence of a diagonal convergence zone that generally persists a few days (Figure 1a), known as the South Atlantic Convergence Zone (SACZ). The SACZ exhibits both continental and oceanic components that regulate the hydrological cycle in densely populated areas of South America. The timing, intensity, and spatial distribution of monsoon rainfall across tropical South America are modulated by various teleconnection and climate variability patterns, including the Atlantic Multidecadal Oscillation (AMO), tropical Atlantic variability, the El Niño-Southern Oscillation (ENSO), and the Madden-Julian Oscillation (MJO).
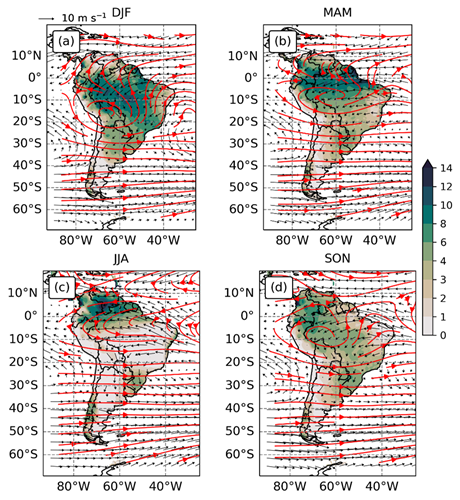
Figure 1: Seasonal climatology (1980-2022) of precipitation (mm day-1; shaded), 850 hPa winds (m s-1 black vectors) and 250 hPa streamlines (red lines).
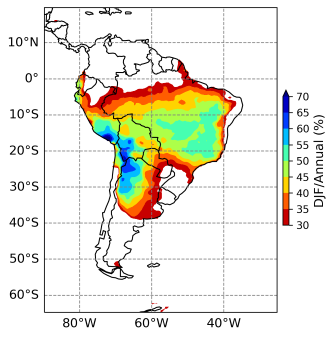
Figure 2: Percentage of the DJF accumulated precipitation with respect to the total annual precipitation.
-
The North American Monsoon System
The North American Monsoon (NAM) system is a dominant atmospheric circulation feature over North America. The NAM core is located in northwestern Mexico between 24°N and 30°N and extends into the southwestern United States to encompass much of Arizona and New Mexico (Figure 3). According to several researchers, the bulk of monsoon moisture is advected at low levels from the eastern tropical Pacific Ocean and the Gulf of California, while the Gulf of Mexico contributes to upper-level moisture.
The characteristic features of the NAM involve a seasonal wind reversal, from westerly to easterly flow, which occurs between May and June at 700 hPa, and between June and July at higher levels of the atmosphere. Additionally, there is an increase in relative humidity at different levels of the atmospheric column and a summer peak rainfall (Figure 4) that shifts from July to August as the warm season evolves. The July maxima dominate the inland precipitation regime and a tendency occurs for August maxima at low-elevation stations along the eastern coast of the Gulf of California and for September maxima across Baja California Peninsula. This late season maximum across Baja California Peninsula is attributed to an increase of tropical storm landfall during this period and the development of organized storms known as mesoscale convective systems.
The interannual variability of the NAM is high. Along with numerous transient disturbances (e.g. tropical cyclones, mesoscale convective systems, easterly tropical waves, inverted troughs, the Madden Julian Oscillation, and mid-latitude troughs), rainfall variations in the NAM are significantly influenced by the strength and position of the monsoon anticyclone (between 700 hPa and 500 hPa), which moves from central Mexico in May to northern Mexico in July and August. The increase in moist instability and precipitation from the NAM over much of Mexico has been related to variations in sea surface temperature and Pacific circulation patterns, and to the intensification of the North Atlantic Subtropical High (NASH) in response to decadal-scale variations in western Atlantic and Caribbean SST. In addition, the thermal contrast between the continent and the adjacent oceanic regions of the eastern Pacific supports the formation of the NAM system.
The combination of these large-scale factors modulates both the spatial and temporal patterns of rainfall accumulation resulting in high interannual variability that is not strongly linked to El Niño or other common sources of interannual circulation variability. The poleward extension of the summer precipitation regime in northwestern Mexico begins with an abrupt onset of precipitation in late June or early July and rapidly extends northward along the western slopes of the Sierra Madre Occidental. At the onset, weather conditions rapidly change from warm and dry to relatively cool and rainy conditions, particularly at higher elevations. The increase in precipitation coincides with increased vertical transport of moisture by convection and the occurrence of southerly winds along the Gulf of California. In July-August-early September, the monsoon system is fully developed and the heaviest rainfalls are observed to the west of the SMO. From late September to October, precipitation over northwestern Mexico decreases in response to the southward movement of the NAM upper level anticyclone, to a weakening of the land surface heating and southerly flow, and to the retraction of the NASH to the east.
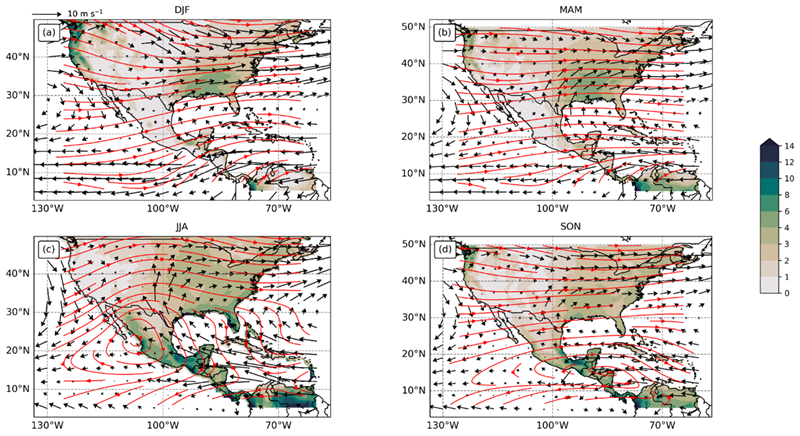
Figure 3: Seasonal climatology (1980-2022) of precipitation (mm day-1; shaded), 850 hPa winds (m s-1 black vectors) and 250 hPa streamlines (red lines).
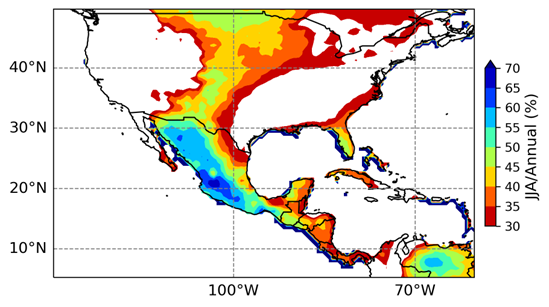
Figure 4: Percentage of the JJA accumulated precipitation with respect to the total annual precipitation.
Note: All figures were organized by Michelle Reboita using Climate Prediction Center (CPC) precipitation dataset and ERA5 reanalysis.
Regional Working Groups
Regional Working Group Members
| Name | Designation | Institute | Photos |
|---|---|---|---|
| Michelle Simões Reboita, | Co-chair | Universidade Federal de Itajubá, Brazil | 
|
| Caio Augusto dos Santoa Coelho, | Co-chair | Instituto Nacional de Pesquisas Espaciais (INPE), Brazil | 
|
| Leila Carvalho | (Co-Chair, CLIVAR/GEWEX Monsoons Panel) | University of California at Santa Barbara (UCSB), USA |  |
| Paola A. Arias | (Co-Chair, GEWEX Hydroclimatology Panel) | Universidad de Antioquia, Colombia | 
|
| Vasubandhu Misra | (Member, CLIVAR/GEWEX Monsoons Panel) | Department of Earth, Ocean and Atmospheric Science, Florida State University, USA | 
|
| Luis Brito-Castillo | (Member, CLIVAR/GEWEX Monsoons Panel) | Centro de Investigaciones Biológicas del Noroeste S.C. (CIBNOR), Mexico |  |
| Moetasim Ashfaq | Member | Oak Ridge National Laboratory (ORNL), USA | 
|
| Robin Chadwick | Member | Met Office & University of Exeter, UK |  |
| Josefina Blázquez | Member | Universidad Nacional de La Plata, Argentina | 
|
| Fernanda Cerqueira Vasconcellos | Member | Federal University of Rio de Janeiro (UFRJ), Brazil | 
|
| Marcia Zilli | Member | University of Oxford, UK |  |
| Shaukat Ali | Member | SickKids Hospital, Toronoto, Canada |  |
| Renata Tedeschi | Member | Instituto Tecnológico Vale, Brazil |  |
| Anita Drumond | Member | Instituto Tecnológico Vale, Brazil |  |